
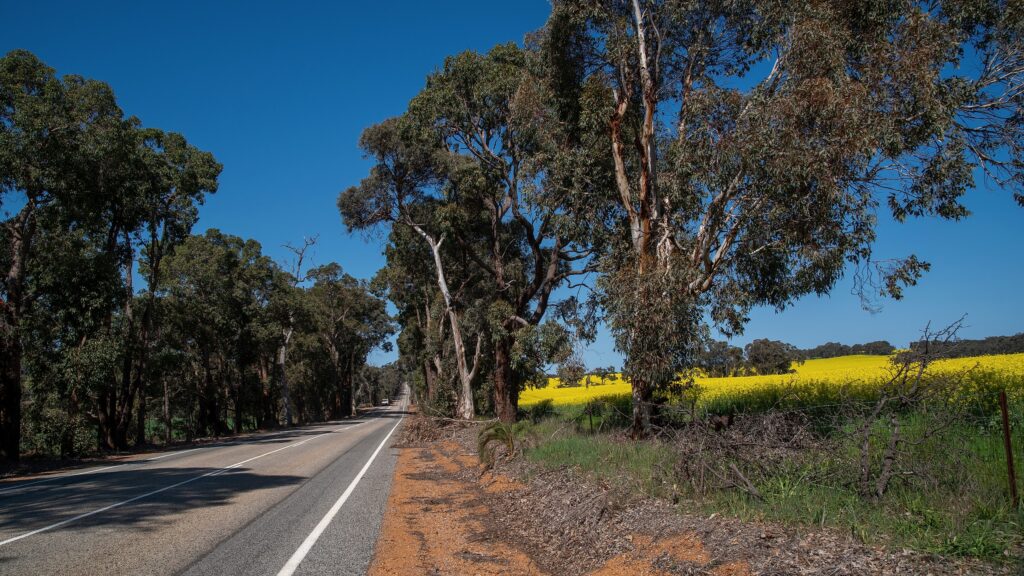
Hero image: “Julimar canola”, Gnangarra, 2025. CC BY 2.5 Australia. Cropped and colour-adjusted by BEC.
Australia’s National Bioenergy Feedstock Strategy has elevated feedstock intelligence to a national investment priority. The commercial question now moves to the basin: which tonnes remain sustainable, contractable and deliverable when yields, water and competing markets tighten at the same time?
That question matters because a national resource estimate and a project supply agreement measure different things. A map can show where biomass exists. An investment case must establish monthly availability, specification, recoverability, competing-use value, grower participation, delivered cost and performance through an adverse season.
The strategy arrives alongside an A$1.1 billion Cleaner Fuels Program, work on a demand-side market measure, expansion of the Guarantee of Origin scheme to low-carbon liquid fuels, a A$250 million innovation fund and A$33.5 million previously committed to sustainable aviation fuel development. Production support, demand formation and certification can now advance together. Their effectiveness will depend on the quality of the regional feedstock systems beneath them.
The decisive Australian opportunity is therefore a portfolio of bankable basins. Each basin will have its own climate distribution, alternative-use shadow price, infrastructure logic and feedstock development pathway.
Four signals for investors
- National abundance can coexist with local contractual scarcity. The commercial unit is the adverse-year delivered tonne inside an economic collection radius.
- Existing markets set the entry price. Export canola, livestock feed, pulpwood, panels and industrial heat create reference values that a new buyer must understand.
- Climate risk reaches both sides of the margin. A dry season can reduce recoverable volume while raising the value of grain, fodder, straw and irrigation water.
- Energy crops can add designed supply. Intermediate crops, perennial grasses and woody systems create new dry-matter options when matched to land capability, water balance, rotations, harvesting and long-term demand.
Policy has changed the investment sequence
The Australian Government’s five priorities are unusually close to the work required before project finance: investment-grade data, feedstock readiness, regional supply chains, sustainability and certification, and sector capability. The strategy also calls for information on seasonality, variability, competing uses, infrastructure, transport, workforce and processing.
This creates a practical sequence for developers and financiers. Capital support and demand incentives increase the value of early basin definition. Regional resource owners gain a clearer route to aggregate supply. Producers gain a framework for new contracts and agronomic trials. Lenders and offtakers gain a basis for testing volume resilience, traceability and replacement options.
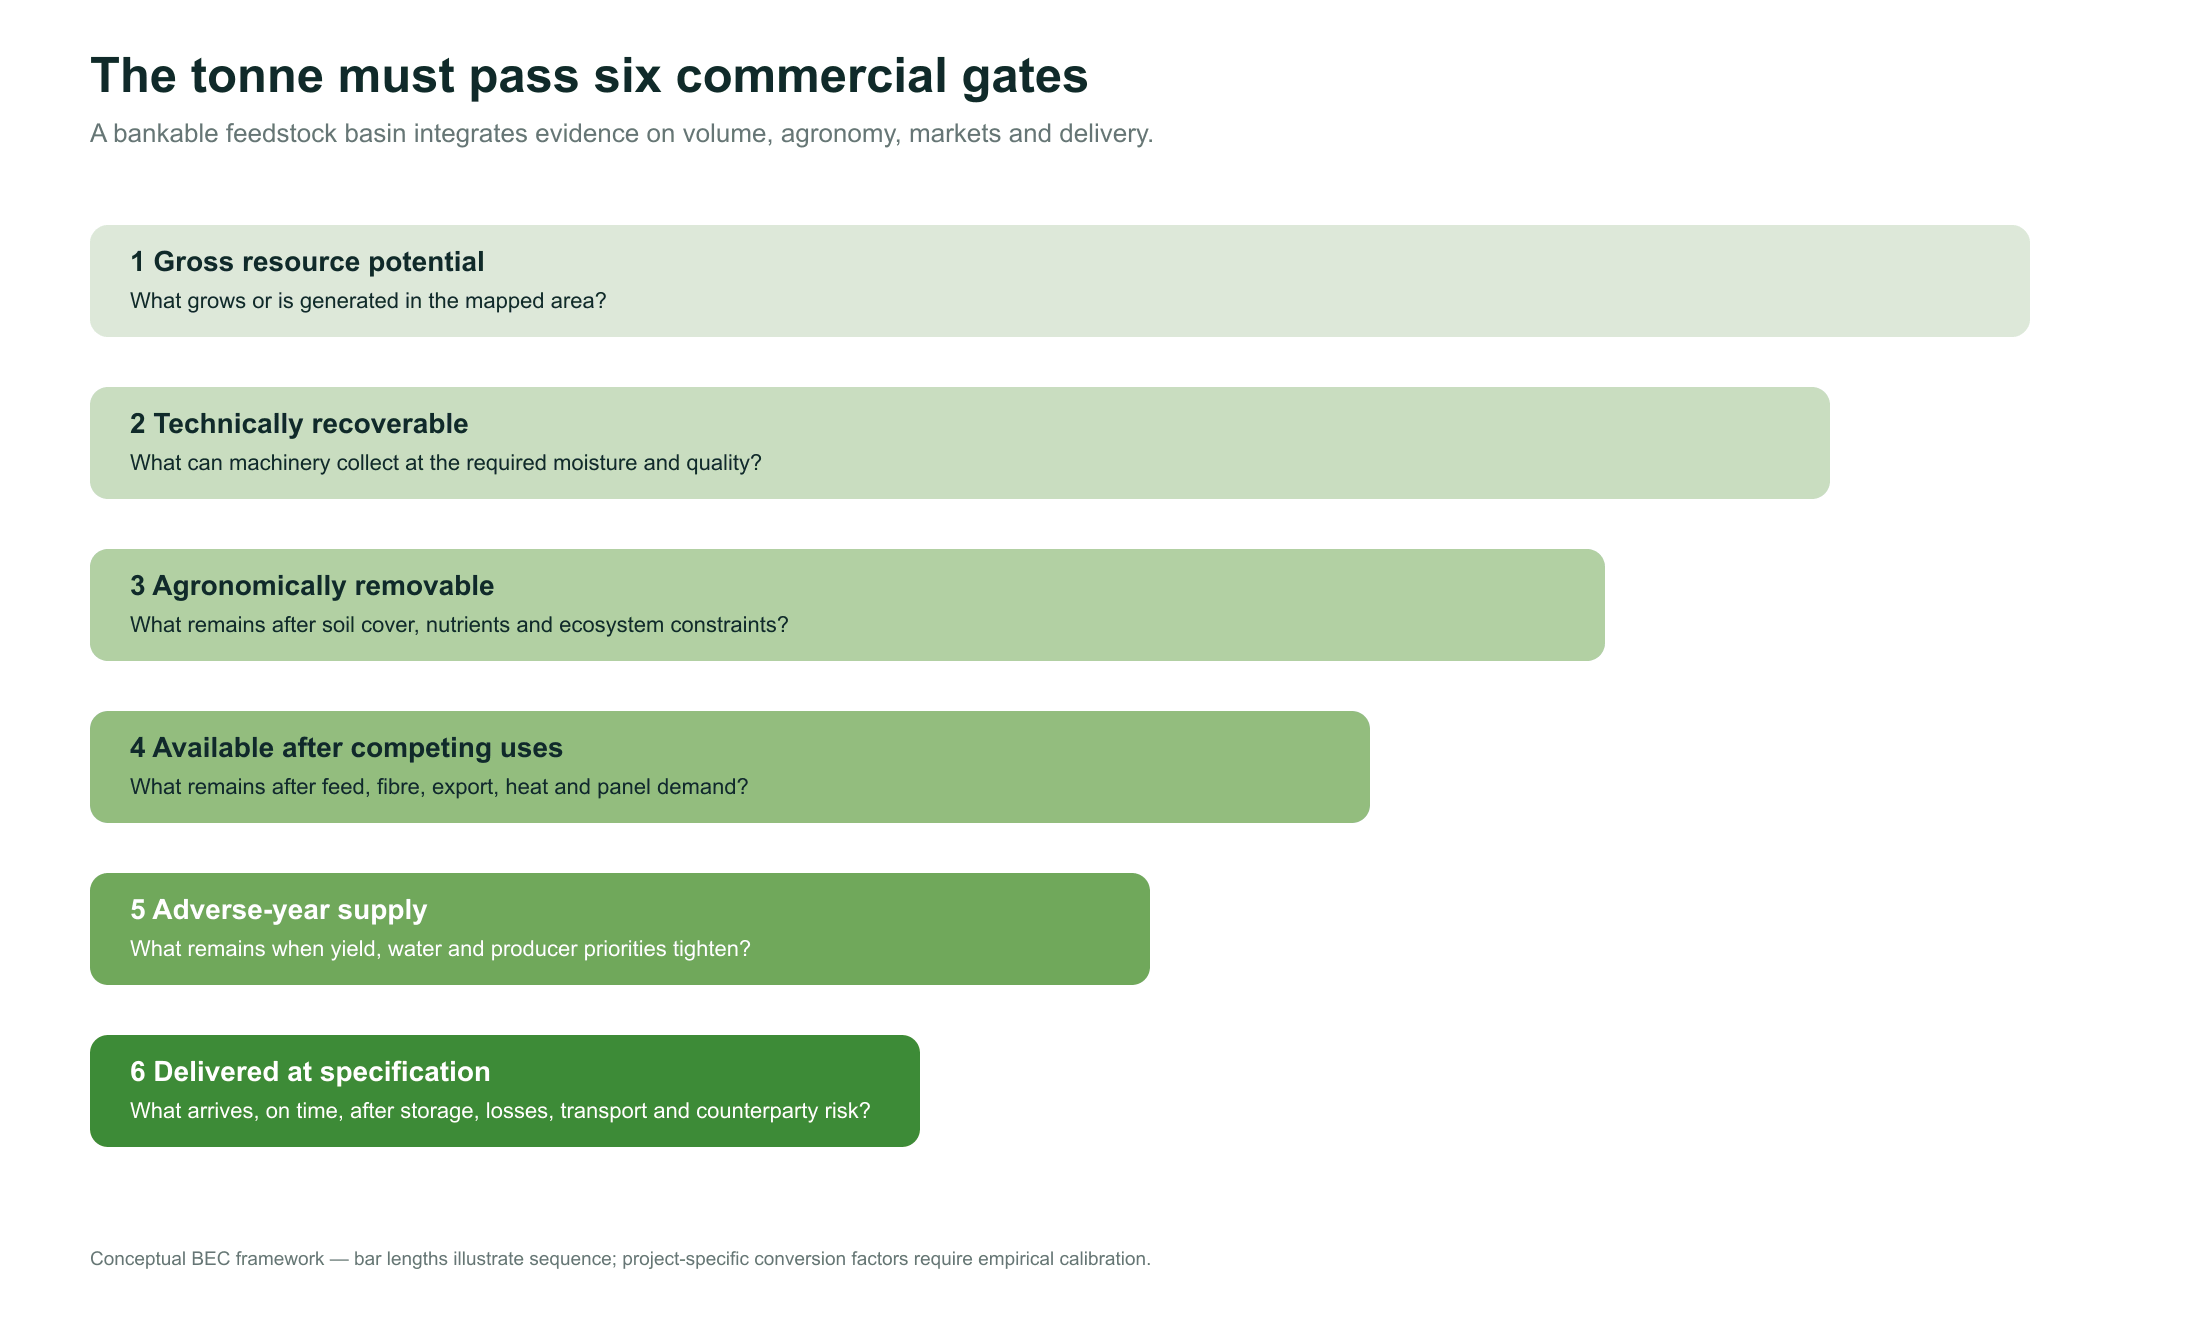
The next wave of diligence will begin with annual theoretical tonnage and extend to monthly supply curves, grade-specific volumes, harvest windows, storage losses, road and rail constraints, farm economics, counterparty concentration and climate percentiles. Template contracts and pricing frameworks, highlighted in the strategy, can reduce transaction costs once these physical and commercial variables are quantified.
Four basins, four distinct commercial problems
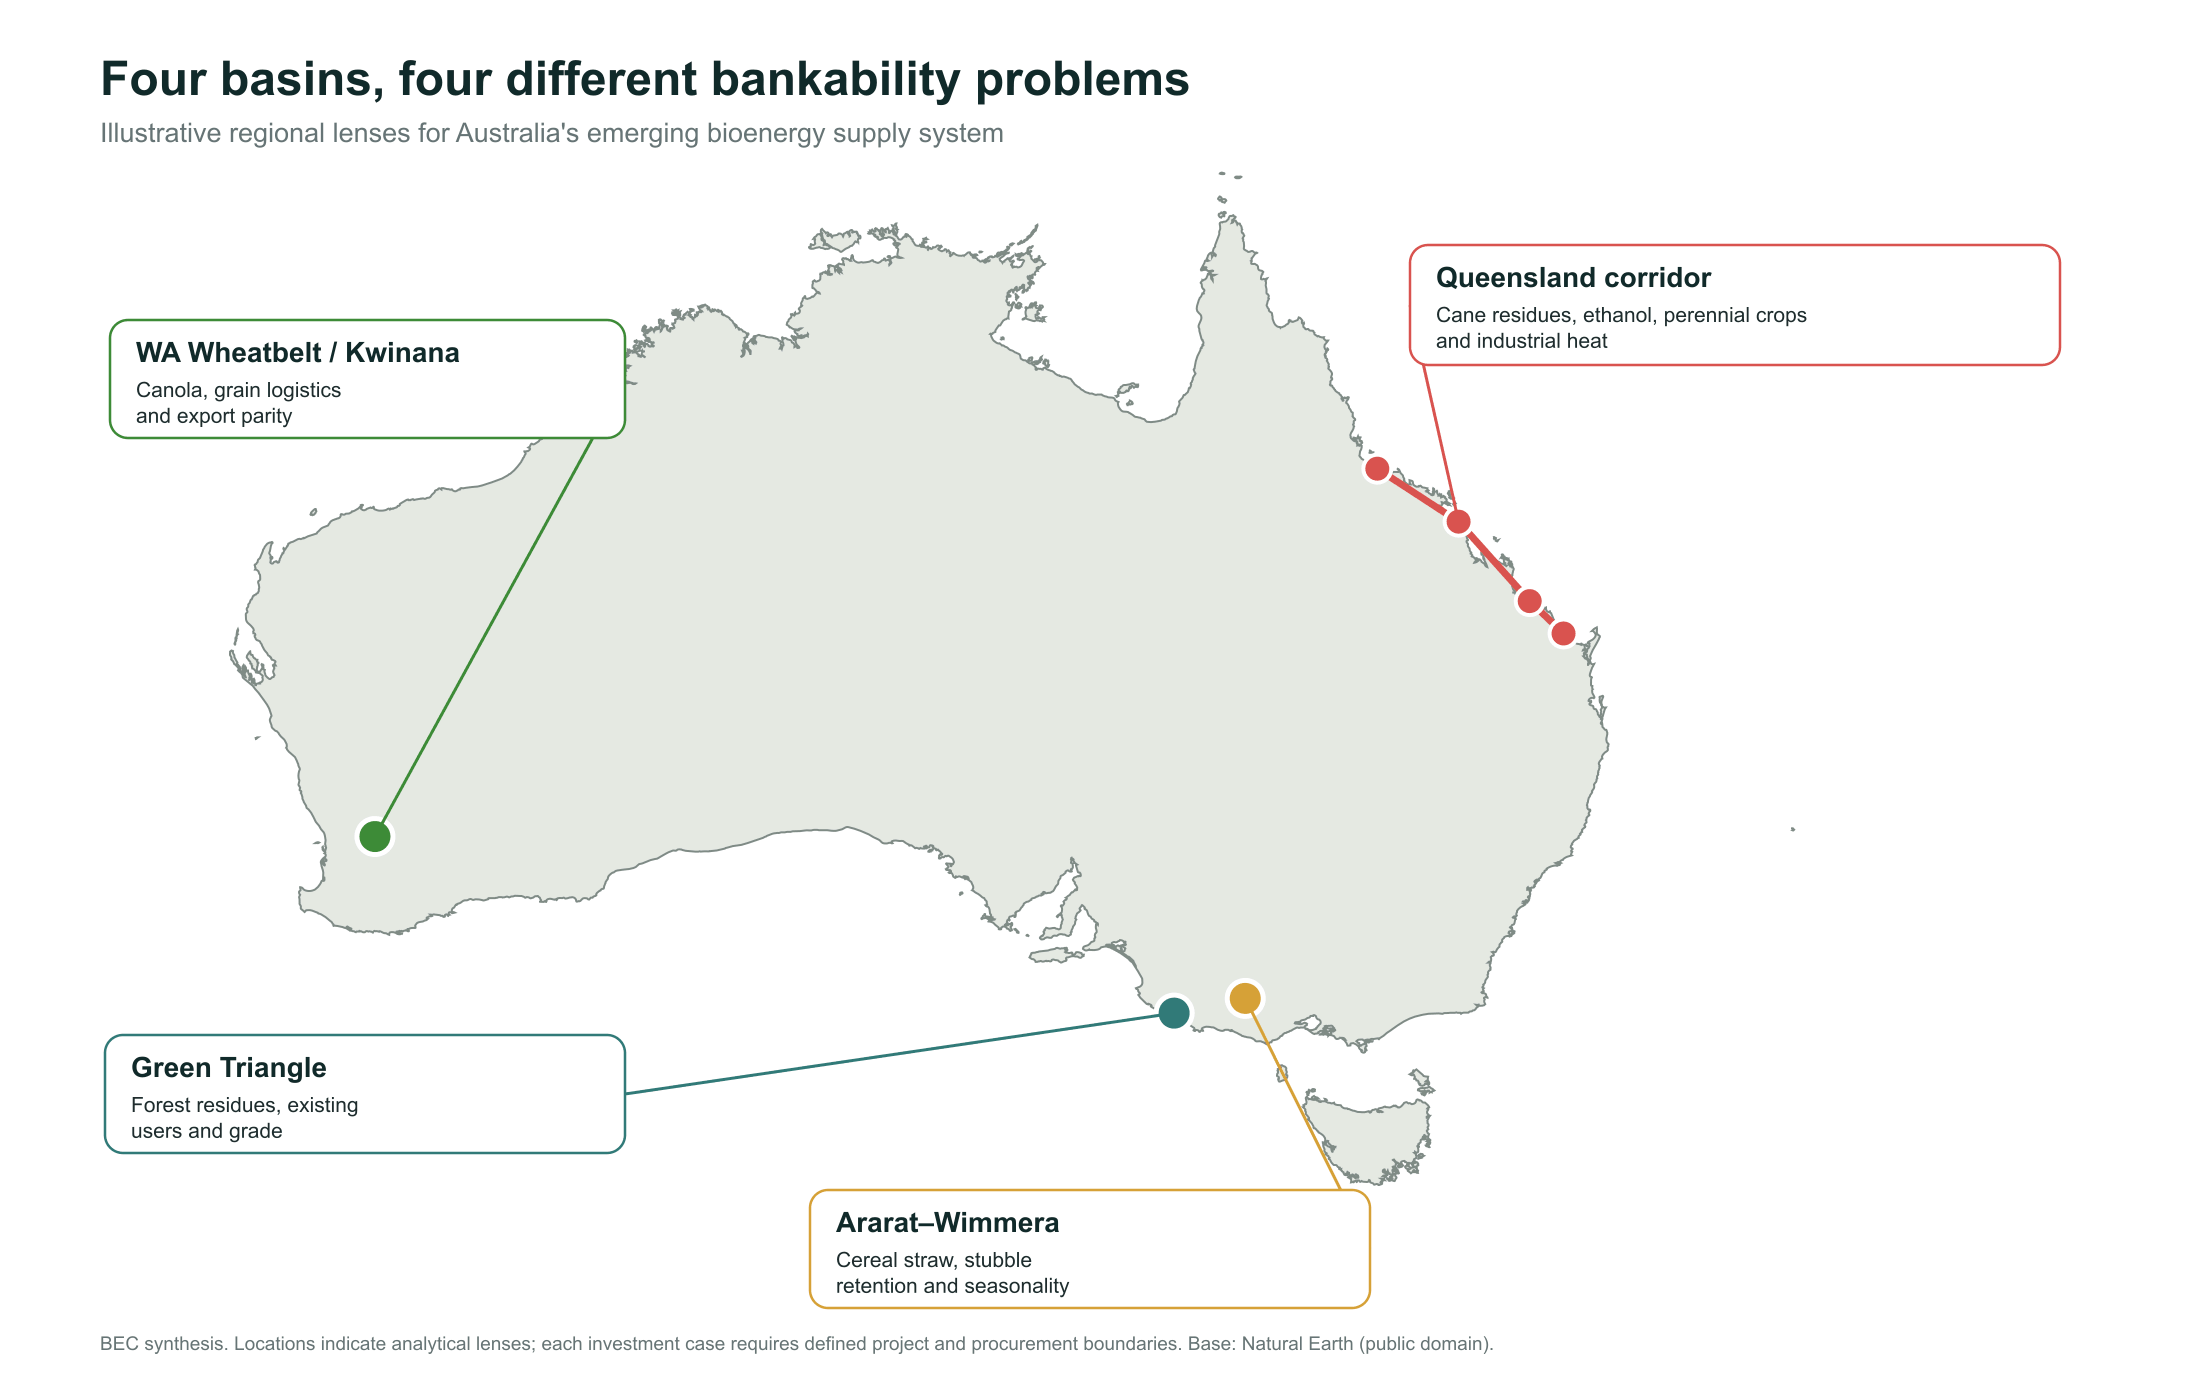
Australia’s agricultural and forestry geography creates several credible pathways. Each regional case presents a different bankability equation.
Western Australia: canola enters with a global reference price
Western Australia produces an average of about 2.2 million tonnes of canola a year, worth around A$1.2 billion. The state exports 90% of production, while two local crushers process approximately 60,000 tonnes annually. Canola is also a valuable break crop in cereal rotations and its oil content, certification and segregation systems already support demanding export markets.
For a domestic HEFA, renewable diesel or intermediate-processing project, this is a commercially mature feedstock with visible competition. Export parity, freight, oil value, meal value, crop rotation economics and crushing capacity shape the procurement envelope. Additional demand can influence planted area and local processing, yet annual rainfall and global prices will continue to influence farmer decisions.
The investment question is precise: what contract structure gives growers a compelling rotation return while preserving processor margins across price and yield scenarios? A basin model should therefore link farm gross margin, crop choice, oil yield, certification, receival infrastructure, crushing yield, co-product value and port alternatives.
Ararat–Wimmera: cereal straw carries an agronomic floor
The strategy uses a proposed A$400 million biomethane project near Ararat to illustrate the value of quantifying seasonally contractable cereal straw. The wording matters. Straw availability begins with grain production and then passes through stubble retention, soil cover, nutrient replacement, livestock demand, baling conditions, moisture, storage and collection cost.
Agriculture Victoria reports that more than 80% of northern Wimmera paddocks and almost 75% of southern Wimmera cropped paddocks retained stubble in 2021. Retention supports erosion control, moisture conservation, rainfall infiltration and nutrient cycling. It also interacts with sowing systems, weeds, pests and disease. Strategic baling can create value in selected years, including animal bedding, compost, feed and bioenergy.
These farm-system functions create an agronomic retention requirement and a competing-use value. A robust supply agreement can encode minimum ground cover, field eligibility, nutrient compensation, quality bands, weather windows and volume flex. The resulting number is a contractable straw curve by season and distance, supported by field evidence.
Green Triangle: residue value depends on grade and incumbent demand
The Green Triangle combines a substantial plantation base, established harvest and processing infrastructure, and access to ports. It also supports existing timber, pulp, woodchip, panel and energy markets. Every residue class therefore carries a quality grade, location and alternative route to market.
Australia had 1.71 million hectares of commercial plantations in 2022–23. Hardwood plantation area has declined from its 2008–09 peak, while annual new establishment since 2011–12 has remained at 4,500 hectares or fewer. ABARES projects national hardwood log availability to move from around 12 million cubic metres a year in 2025–29 to around 9 million by 2040–44. Softwood availability follows a different trajectory and is projected to grow.
These structural trends give regional bioenergy projects a clear diligence task: segment material by species, product grade, moisture, particle size, ownership, harvest schedule and incumbent use. Low-grade residues may support new conversion routes, while higher-grade material can carry pulp, panel or export value. Climate, fire, pest and replanting assumptions belong inside the same long-term supply model.
The strategy references a planned hub-and-spoke biomass-to-methanol concept linked to a central sustainable aviation fuel refinery. That configuration can reduce first-mile hauling of bulky material and concentrate an intermediate closer to source. Its commercial performance will depend on hub siting, conversion yield, asset utilisation, grade allocation and the cost of moving both raw biomass and intermediates.
Queensland: infrastructure and new demand create a designed-crop opportunity
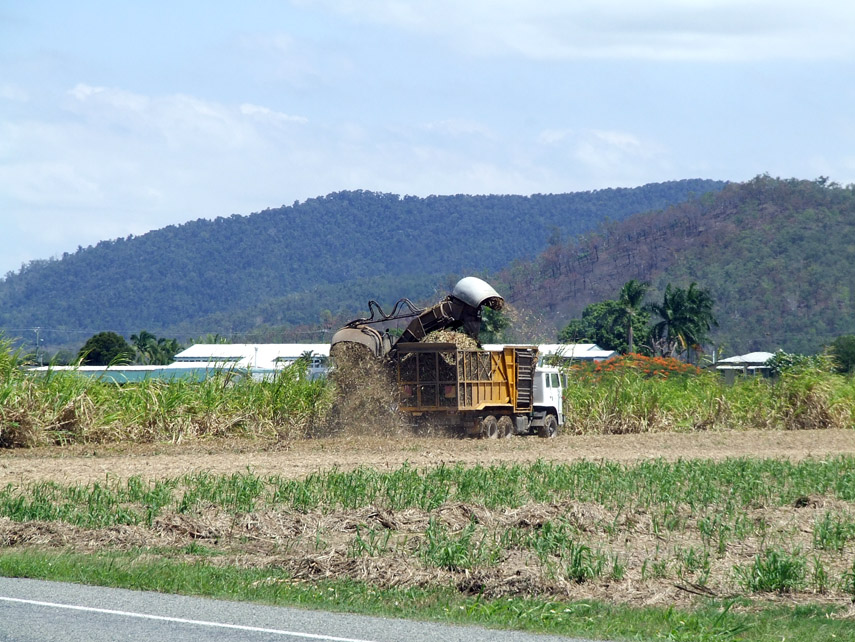
Queensland offers a different pattern: concentrated cane infrastructure, an established ethanol base, industrial heat demand, ports and a long coastal production corridor. The sugar industry’s rail network extends for roughly 4,000 kilometres and mills operate around a seasonal crushing window. Existing logistics can support additional supply-chain concepts where equipment compatibility, storage, corridor access and off-season economics align.
Two recent project signals show the breadth of demand. Project Ulysses in Townsville completed a FEED-stage program for an alcohol-to-jet facility designed around 183 million litres a year of agricultural by-product ethanol, with a proposed output of 113 million litres of low-carbon liquid fuels. In central Queensland, SuperChar has lodged a development application for a A$30 million facility and announced a five-year agreement to supply Rio Tinto with 35,000 tonnes of bana-grass bio-pellets in 2028, subject to approvals. A 12-hectare field trial provides an early agronomic evidence layer.
Together, these cases show how demand for ethanol, industrial heat, biochar and pellets can converge within one state. They also raise the value of crop design. A perennial grass programme requires local yield distributions, irrigation or rainfed water balance, nutrient demand, harvest cycles, feed quality options, fire management, storage behaviour and delivered-cost curves. Queensland’s climate adds both high rainfall potential and exposure to heat, drought, flooding and cyclones across distinct subregions.
Climate belongs inside the supply contract
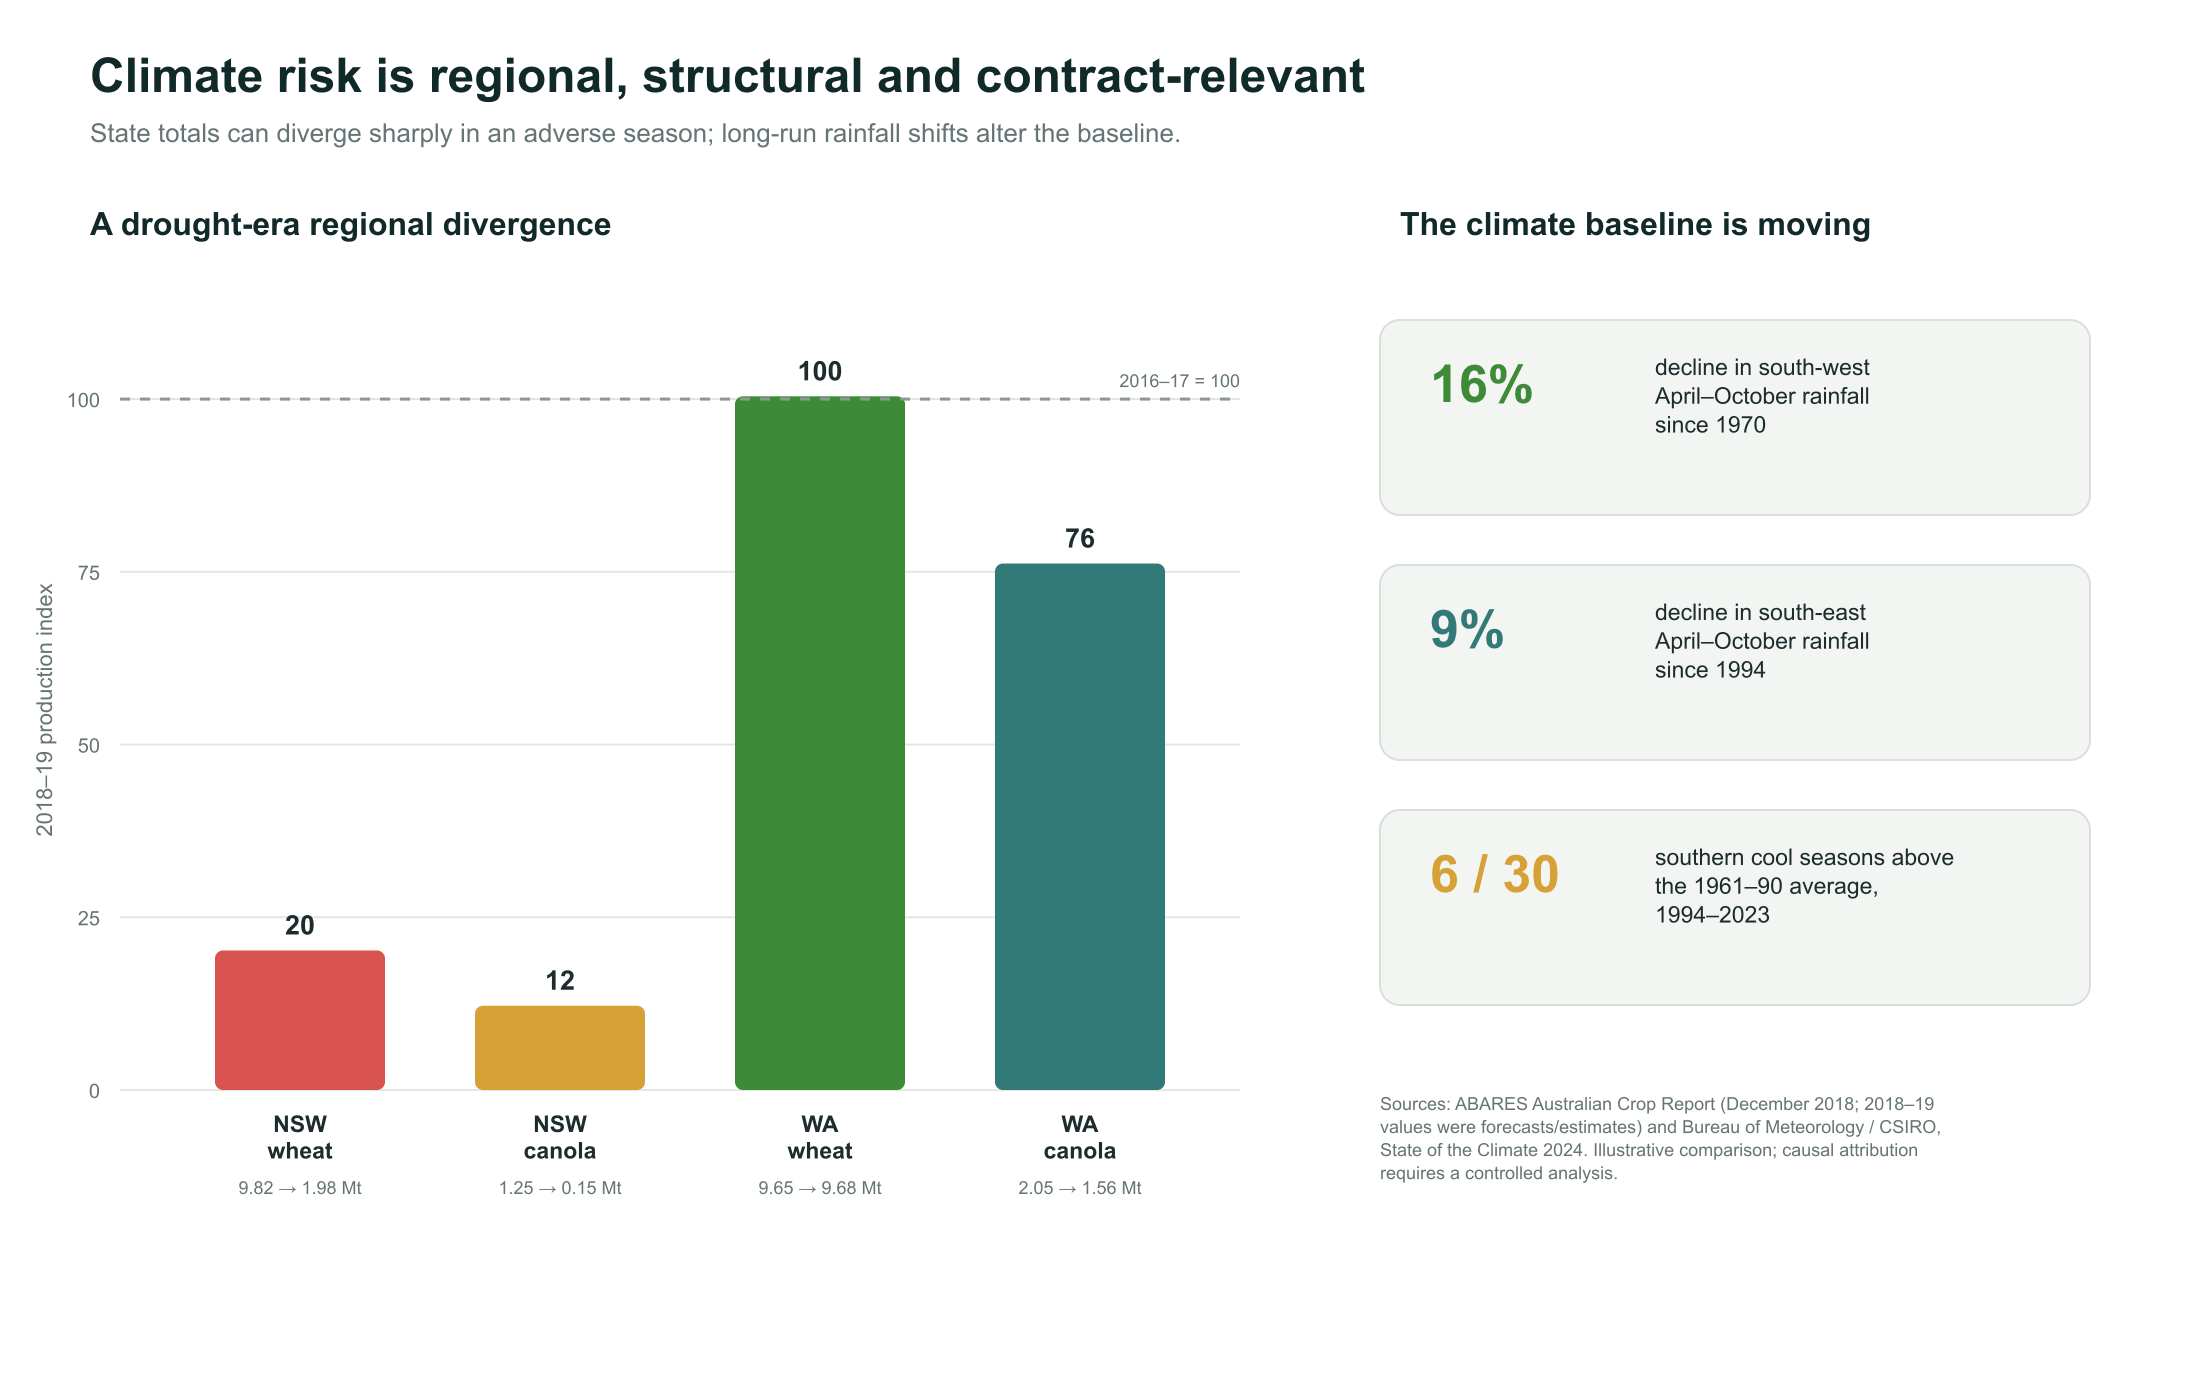
Australia’s feedstock strategy explicitly recognises climate variability. The commercial model now needs to convert that recognition into volumes, prices and contract terms.
The Bureau of Meteorology and CSIRO report a 16% decline in April–October rainfall in south-west Australia since 1970 and a 9% decline across the south-east since 1994. Six of the thirty southern cool seasons from 1994 to 2023 recorded rainfall above the 1961–90 average. Australia has also warmed by 1.51°C since 1910, and extreme heat and dangerous fire-weather conditions have increased across many regions.
ABARES models a normal-year wheat yield of 2.4 tonnes per hectare and a 10th-percentile drought-year yield of 1.7 tonnes per hectare for the 2015–16 to 2019–20 technology period, a 28.1% drought-risk gap. Its climate scenarios also project average Australian prices for major grains rising by 3% to 24% as drought-driven shortages and price spikes become more frequent or severe.
Historical regional production illustrates the concentration risk. Between 2016–17 and the drought-affected 2018–19 estimate, New South Wales wheat output moved from 9.82 million tonnes to 1.98 million tonnes and canola from 1.25 million tonnes to 0.15 million tonnes. Western Australian wheat stayed close to 9.7 million tonnes across the same comparison, while canola moved from 2.05 million tonnes to 1.56 million tonnes. These figures provide an illustrative regional contrast; causal attribution requires a controlled analysis.
For project finance, climate risk has four measurable channels:
- Volume: crop yield, residue generation and plantation increment vary by season and location.
- Recoverability: wet fields, fire damage, moisture, soil-cover requirements and harvest windows alter collectible tonnes.
- Price: grain, fodder, fibre and water values can rise as regional supply tightens.
- Delivery: roads, rail, storage, ports and counterparties face correlated disruption during extreme events.
A lender-grade model should therefore show P50, P75 and P90 delivery cases, with transparent links between climate indices, farm response, competing demand, inventory buffers and replacement procurement. Contract design can then allocate volume flexibility, indexation, carryover stocks, force-majeure triggers and replenishment obligations to the parties best placed to manage them.
Designed feedstock portfolios can widen the supply envelope
Residues provide an immediate starting point. Purpose-grown and rotation-integrated feedstocks can add a second supply layer by converting land capability and seasonal windows into planned industrial dry matter.
Intermediate crops can occupy calendar space between primary crops where rainfall, stored soil moisture and harvest timing support a positive farm margin. Their investment case rests on water opportunity cost, rotational effects, sowing and harvest conflicts, biomass quality and the value of the following crop.
Perennial grasses can create multi-year supply near conversion assets in suitable warm or temperate zones. Establishment survival, annual dry-matter yield distribution, nutrient removal, water source, harvest frequency, fire exposure, storage and alternative feed value determine the contractable profile.
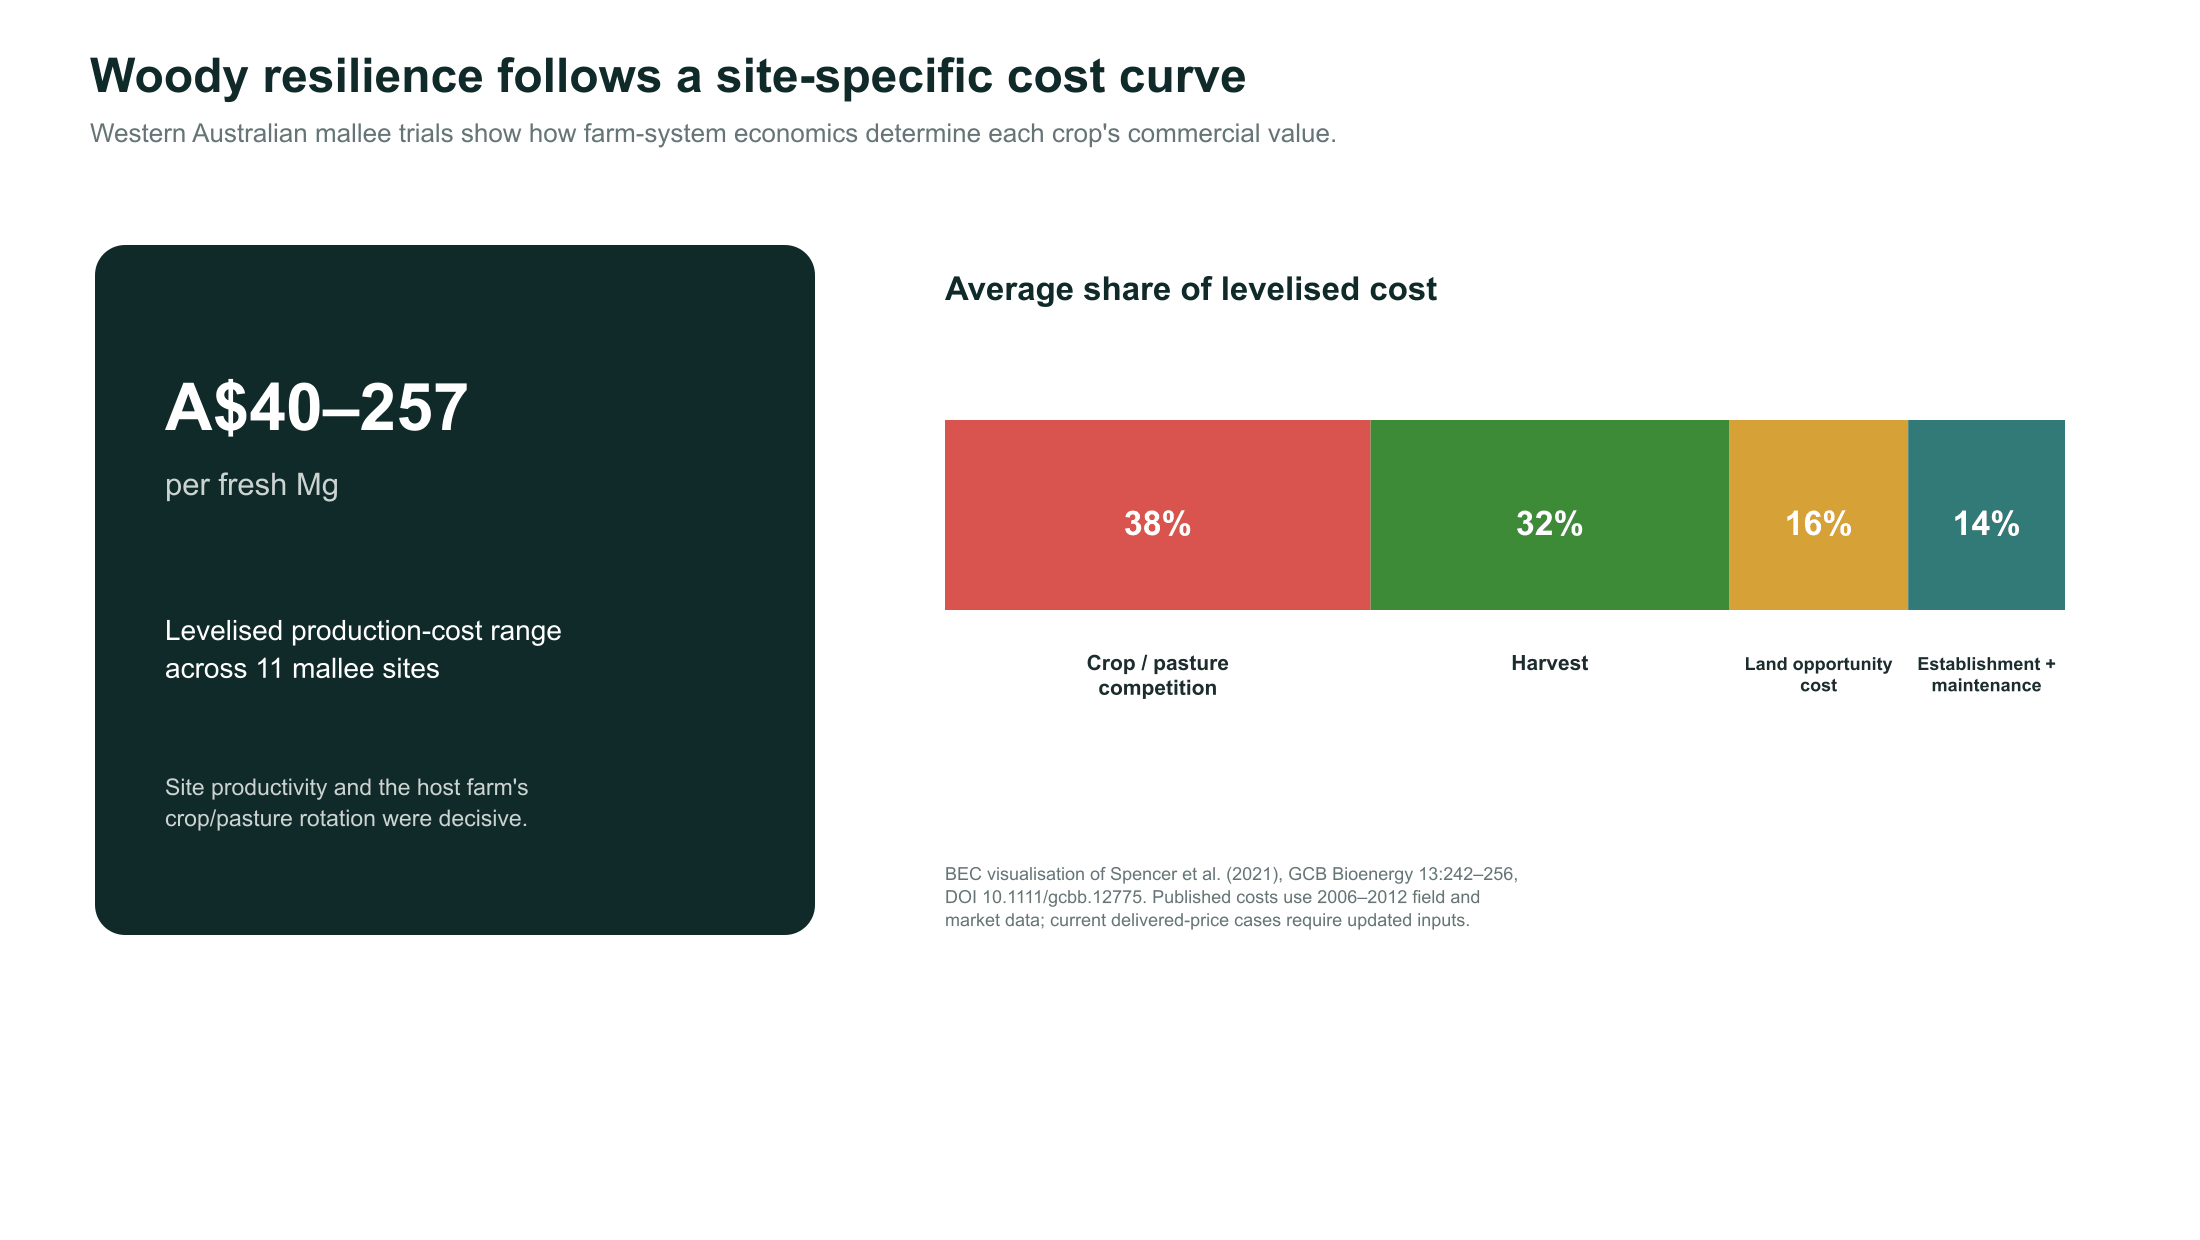
Woody and bush systems can integrate standing biomass with farm shelter, salinity management, erosion control or landscape restoration. Western Australian mallee research across eleven sites reported levelised production costs ranging from A$40 to A$257 per fresh megagram using 2006–2012 field and market data. Crop and pasture competition represented 38% of average levelised cost, harvesting 32%, land opportunity cost 16%, and establishment plus maintenance 14%. These historical data establish the commercial mechanism; a current case requires updated site productivity, machinery, labour, finance and delivered-distance inputs.
Recent pongamia research mapped approximately 30 million hectares of biophysical suitability across Australia, with around 17% overlapping agricultural land. Queensland represented the largest suitable area, while Western Australia showed a smaller overlap with agricultural land. This map provides a strategic screening layer. Investment-grade assessment begins with local yield functions, water budgets, harvesting systems, processing routes, producer economics and future-climate scenarios. Published seed-yield ranges remain broad, which makes field trials and locally calibrated models central to commercial decisions.
A lignocellulosic crop can target industrial dry matter under conditions where digestible forage and protein production carry tighter quality and water requirements. The complete investment case still integrates land value, water, labour, livestock strategy, biodiversity, fire, processing specification and community acceptance. This is where land mapping, agronomy and feedstock economics become one discipline.
What an investment-grade basin file contains
| Evidence layer | Decision-grade output |
|---|---|
| Physical inventory | Monthly tonnes by feedstock, quality, location and ownership |
| Land, soil and water | Eligible hectares, constraints, water balance and attainable dry-matter yield |
| Agronomic retention | Soil-cover, nutrient, rotation and ecosystem rules translated into removable volume |
| Climate distribution | P50, P75 and P90 yield and delivery cases with extreme-event sensitivities |
| Competing uses | Alternative-use netbacks, shadow prices and producer-switching triggers |
| Logistics and specification | Storage, losses, preprocessing, transport routes, delivered quality and cost |
| Contracts and counterparties | Supplier concentration, tenure, indexation, flex bands, replacement and credit risk |
| Traceability and carbon | Chain of custody, certification eligibility, emissions factors and data provenance |
This file supports different decisions for each participant. Developers can size technology around credible supply. Investors can test downside coverage and capital staging. Offtakers can evaluate product carbon intensity and continuity. Producers can compare feedstock contracts with their existing crop, livestock and forestry options. Regional planners can identify shared infrastructure whose utilisation improves across several projects.
The decisive tonne
Australia’s strategy has created a national framework for feedstock development at the same moment that production support, demand formation and certification are advancing. The value will be realised basin by basin.
The strongest projects will secure tonnes that carry three forms of evidence: agronomic legitimacy on the land, commercial attractiveness for the supplier and resilient delivery to the plant. That combination defines the decisive tonne in a dry year. It also defines where the next Australian bioenergy investments can scale with confidence.
References and evidence base
- Australian Government, Department of Agriculture, Fisheries and Forestry. National Bioenergy Feedstock Strategy (26 August 2026). Source
- Bureau of Meteorology and CSIRO. State of the Climate 2024 — Australia’s changing climate. Source
- ABARES. Climate change impacts and adaptation on Australian farms. Source
- ABARES. Australian Crop Report, December 2018. Source
- Western Australia Department of Primary Industries and Regional Development. Canola. Source
- Agriculture Victoria. Managing stubble. Source
- ABARES. Indicator 2.1b: Age class and growing stock of plantations (2024). Source
- ABARES. Australian plantation log availability — the next 40 years. Source
- Spencer, B. et al. (2021). “Determinants of the economic viability of mallee eucalypts as a short rotation coppice crop integrated into farming systems of Western Australia.” GCB Bioenergy, 13, 242–256. Source
- Fiot-Mornand, V. et al. (2026). “Balancing multiple sustainability objectives in feedstock cultivation: a case of Pongamia pinnata in Australia.” Journal of Environmental Management, 404, 129255. Source
- Australian Renewable Energy Agency. Jet Zero Australia — FEED Study for Project Ulysses ATJ SAF Plant. Source
- ABC News. “A$30m biochar facility proposed in central Queensland, with Rio Tinto a major buyer” (22 July 2026). Source