
How crop design, harvest timing and operating records shape the cost of every cubic metre of methane.
How much of your plantation’s methane potential reaches the sales meter, and what does each cubic metre cost to produce?
A CBG project can commit years of operating expenditure when it chooses planting material, field layout and harvesting equipment. The consequences appear in irrigation bills, fertiliser applications, machine hours, storage losses and the methane recovered from each delivery.
Consider a simple sensitivity: at the same feedstock cost per tonne of organic dry matter, recovering 20% less methane than assumed raises the feedstock cost per unit of gas by 25%. This is an illustrative calculation. It shows how a change in biological performance can alter the economics of an otherwise unchanged supply contract.
The irrigation system, land lease and harvesting operation still need to be paid when methane recovery falls. A supply contract priced on fresh tonnes can leave that conversion risk with the CBG plant. Linking acceptance criteria to dry matter, organic matter and representative methane tests gives the buyer a clearer view of what each delivery can contribute.
Napier methane yields: the range needs a basis
Napier, widely referenced as Pennisetum purpureum and now classified as Cenchrus purpureus, includes materially different cultivars and hybrids. Published methane yields also reflect harvest age, substrate preparation, inoculum and digestion conditions.
A 2026 experiment comparing Dwarf, Pak Chong 1, Bana and Suvarnabhumi reported methane yields of approximately 211–299 m³ CH₄ per tonne of volatile solids at a 60-day harvest interval. Dwarf reached 299 m³/t VS; the other types ranged from 211.3 to 286.5. Within that experiment, fertilisation increased biomass yield, while the effect on specific methane yield remained statistically inconclusive. Longer harvest intervals changed the suitability of the material for digestion and combustion. Borisoot et al., Energy Nexus, 2026.
In a separate Napier and cow-dung co-digestion study, selected maximum yields for grass and silage treatments were approximately 177–208 mL CH₄/g VS added, depending on mixture and inoculation. These values describe mixed substrates under their respective experimental conditions. Prapinagsorn et al., Energies, 2017.
Volatile solids (VS) describe the organic fraction of dry matter. Numerically, 1 mL/g VS equals 1 m³/t VS when gas reference conditions are equivalent. The values above retain the authors’ reported units; a project comparison also needs a common temperature, pressure and moisture basis.
The percentage basis also changes the supply estimate. In an illustrative comparison, a crop with 20% total solids (TS) and 80% VS within those solids contains 160 kg VS per fresh tonne. At 30% TS and the same VS fraction, it contains 240 kg VS per fresh tonne: 50% more organic dry matter in the same delivered weight. Actual methane output still depends on the methane potential of that material and plant recovery. Every specification should therefore state whether a percentage refers to fresh weight or total solids.
A laboratory biochemical methane potential (BMP) test establishes a reference for a sample. Commercial recovery depends on storage, preparation, the feed blend, loading, residence time and process stability. Upgrading adds another recovery step before methane reaches the saleable product. Those stages need separate assumptions and measurements.
The canopy after cutting reveals the production model
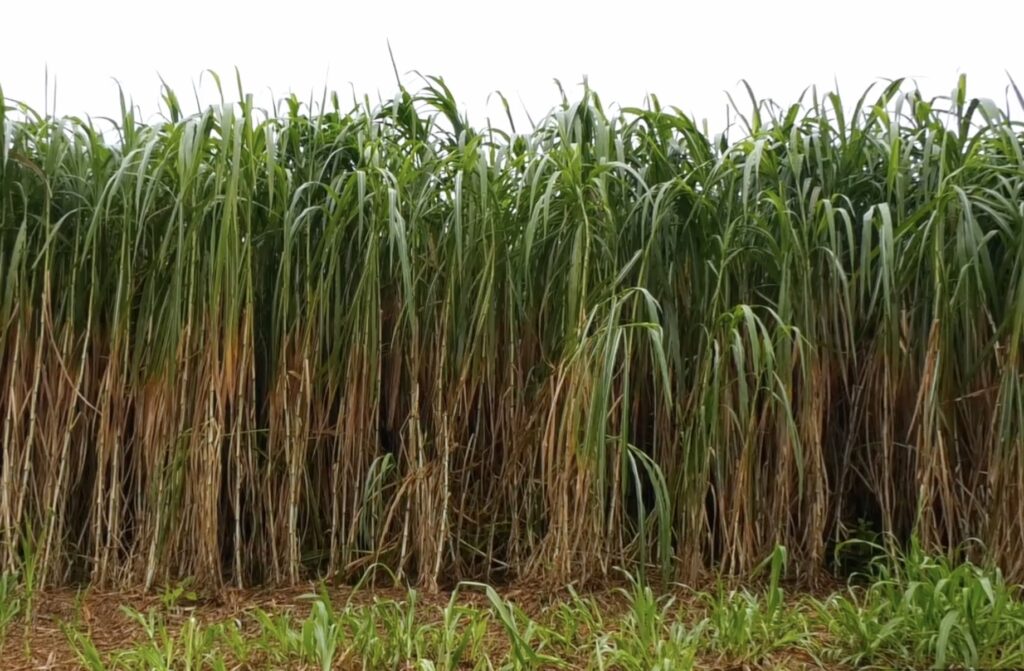
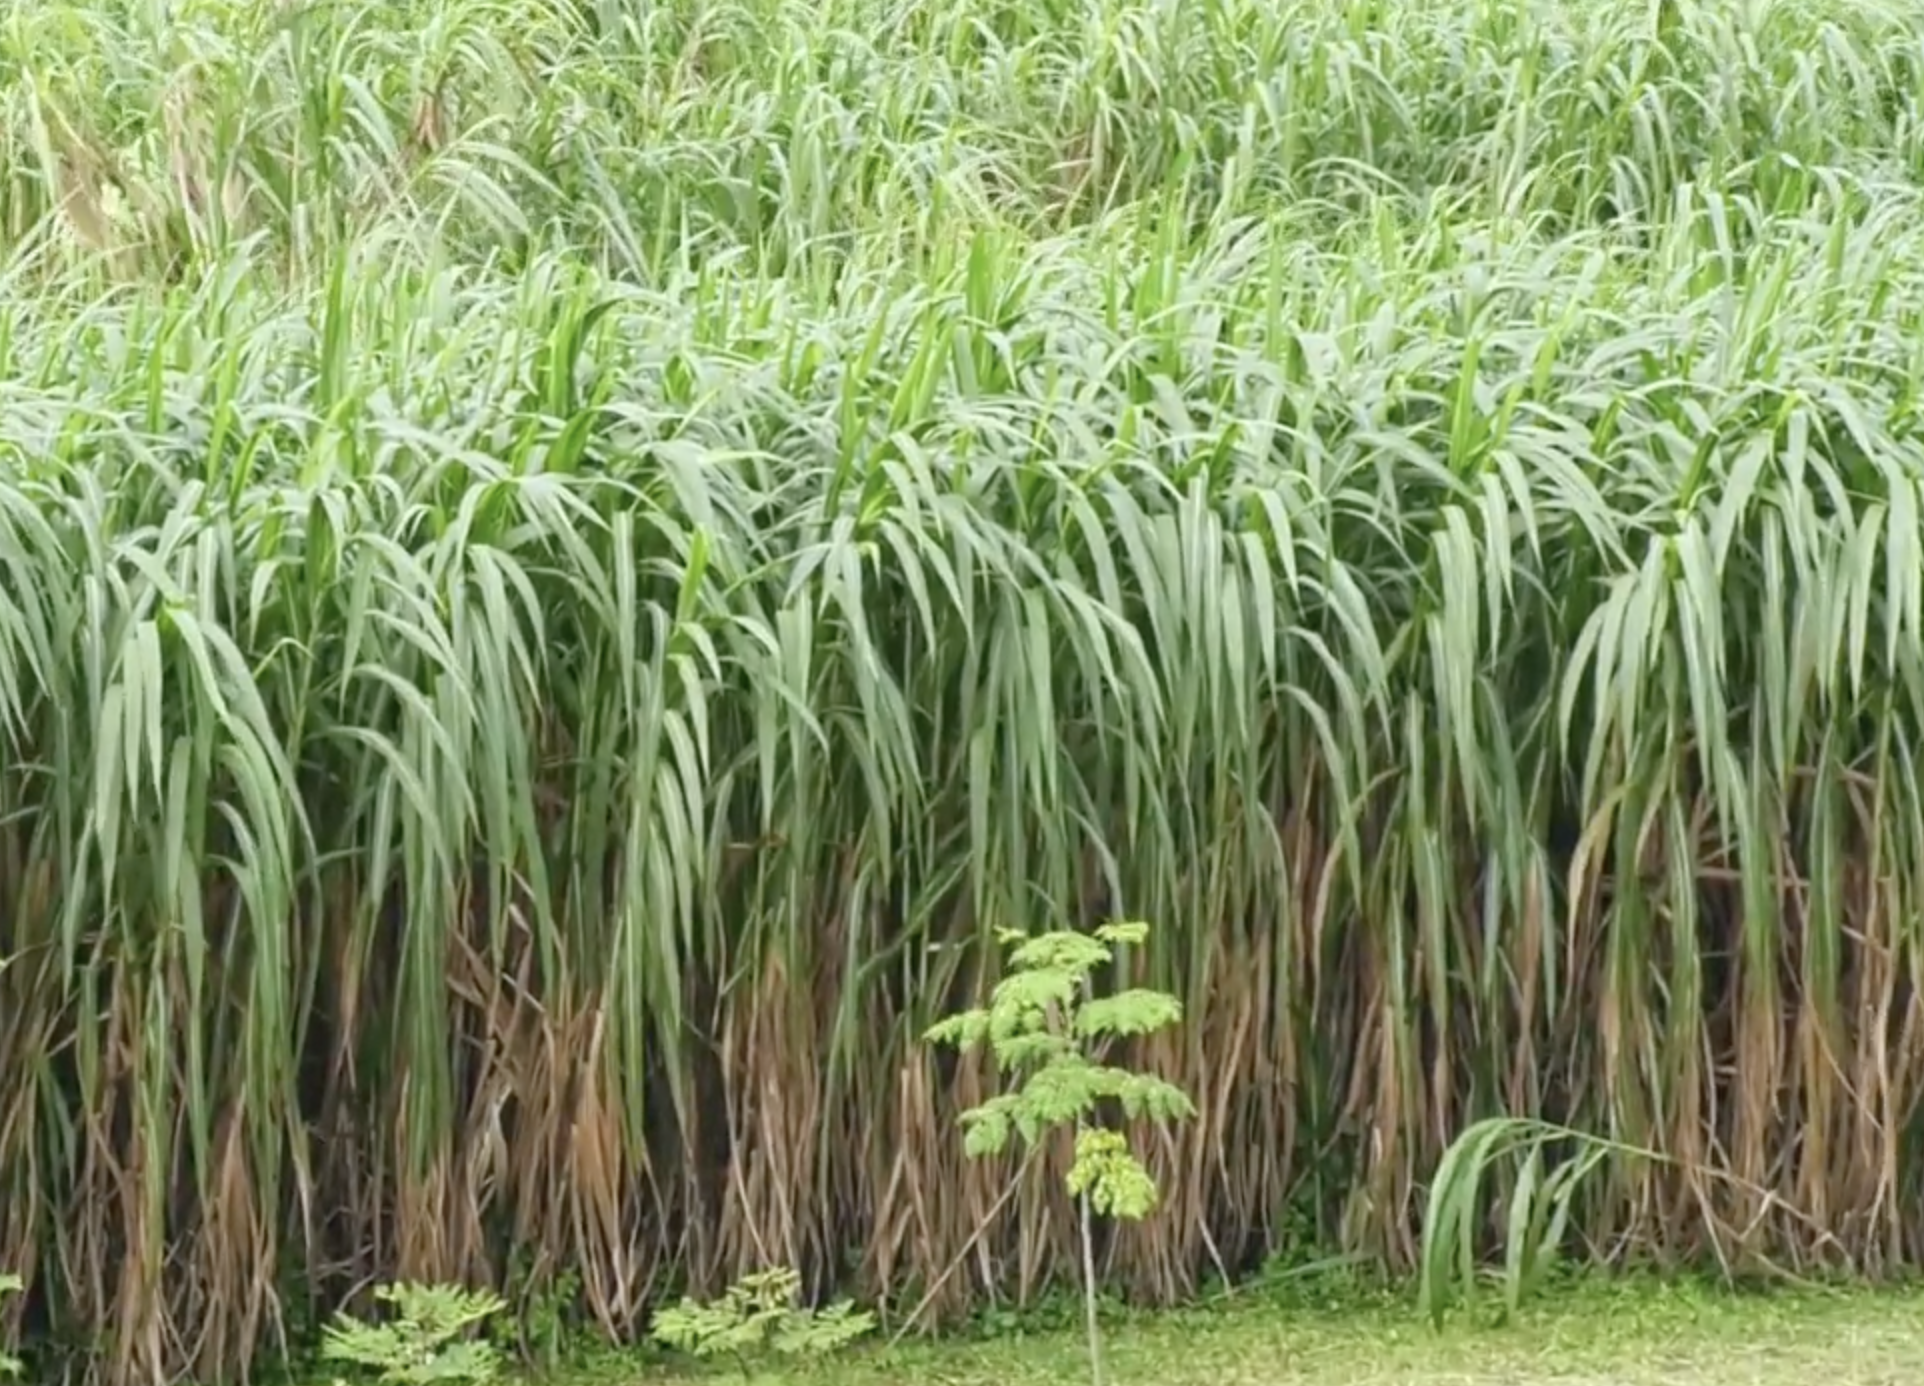
The crop BEC seeks for biomethane rebuilds a continuous canopy quickly after each cut. Numerous tillers occupy the ground, young leaves intercept light, and fresh vegetative growth supplies the next harvest. Rapid recovery across the spaces between rows is part of the design, alongside planned machinery access.
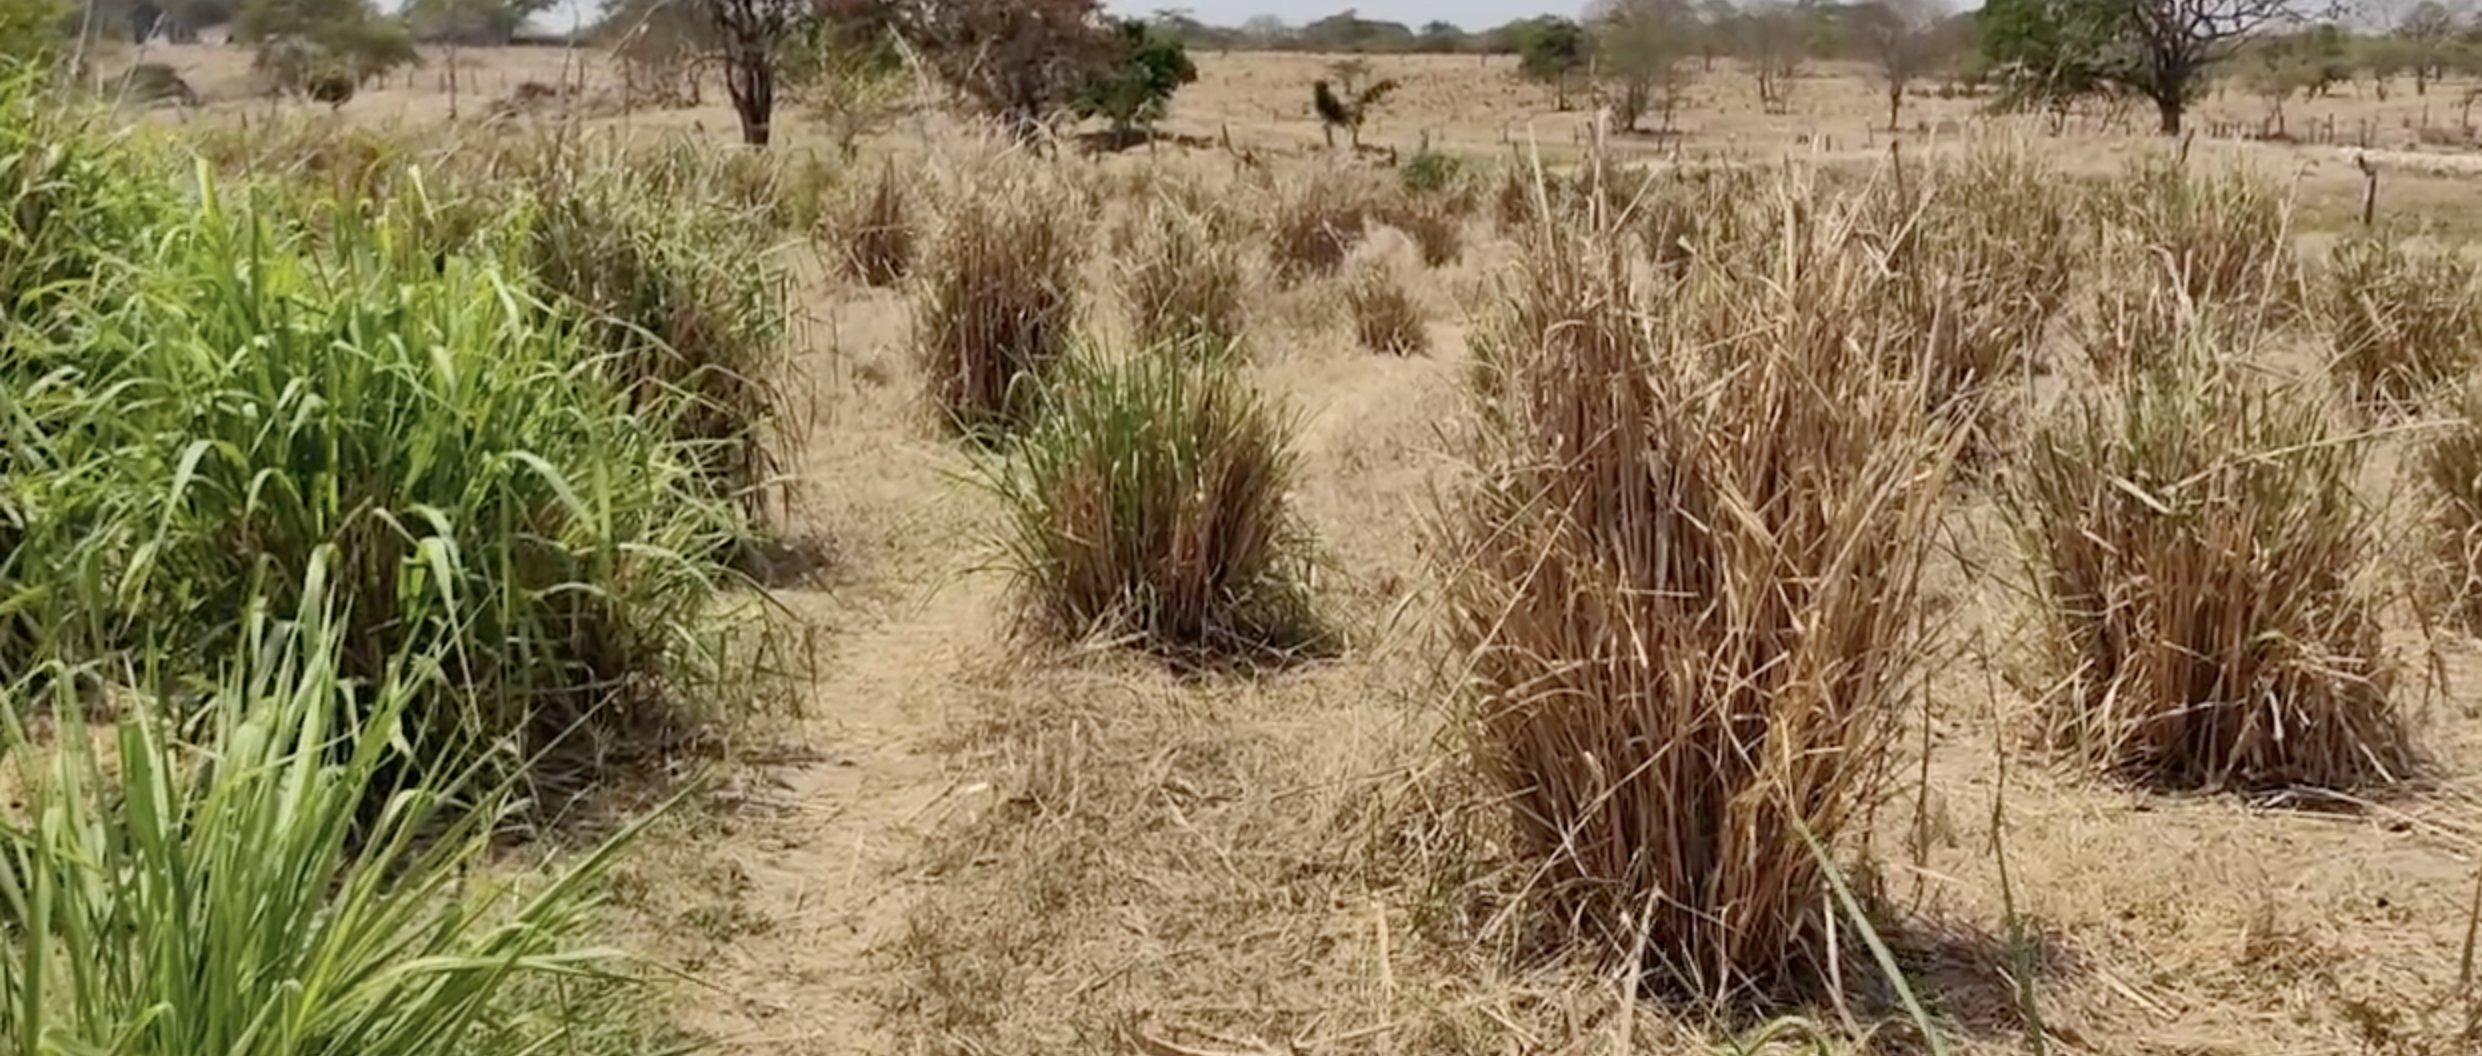
Widely separated clumps and persistent exposed strips create a different production pattern. Delayed canopy recovery leaves part of the field intercepting less light and can increase the need for weed control. A harvest dominated by older, substantial stems changes cutting requirements and the fraction accessible to digestion. Increasing lignification can restrict biological access to structural carbohydrates.
This makes canopy recovery, tillers per square metre and leaf-to-stem ratio useful operating measurements. Plants established per square metre and the number of tillers produced later describe different things. Genetics, establishment and management together determine the stand that develops. A published Napier experiment found interacting effects of cultivar, spacing and harvest age on yield and composition. Napier cultivar, spacing and harvest-age study.
BEC develops denser, rapidly recovering stands around an explicit objective: lower water and cultivation cost per tonne of volatile solids and per cubic metre of recovered methane. The comparison follows irrigation, crop composition, repeated harvests and regrowth. A denser stand can also transpire more water, so the gain has to appear in measured water productivity across the season.
Earlier cutting carries its own cost through more frequent operations and a different annual biomass output. Local pilots identify a harvest window that combines young digestible material, productive cover, workable machinery and sustained regrowth. Several genotypes, suitable alternative grasses and complementary residues can contribute to that programme.
Harvesting costs begin with the field layout
The Indian field examples below show manual cutting among substantial stems and separated clumps with uneven green regrowth. Cutting effort, the proportion of mature stems and the time needed to restore canopy cover are practical matters to investigate alongside sample-based lignin and BMP measurements.
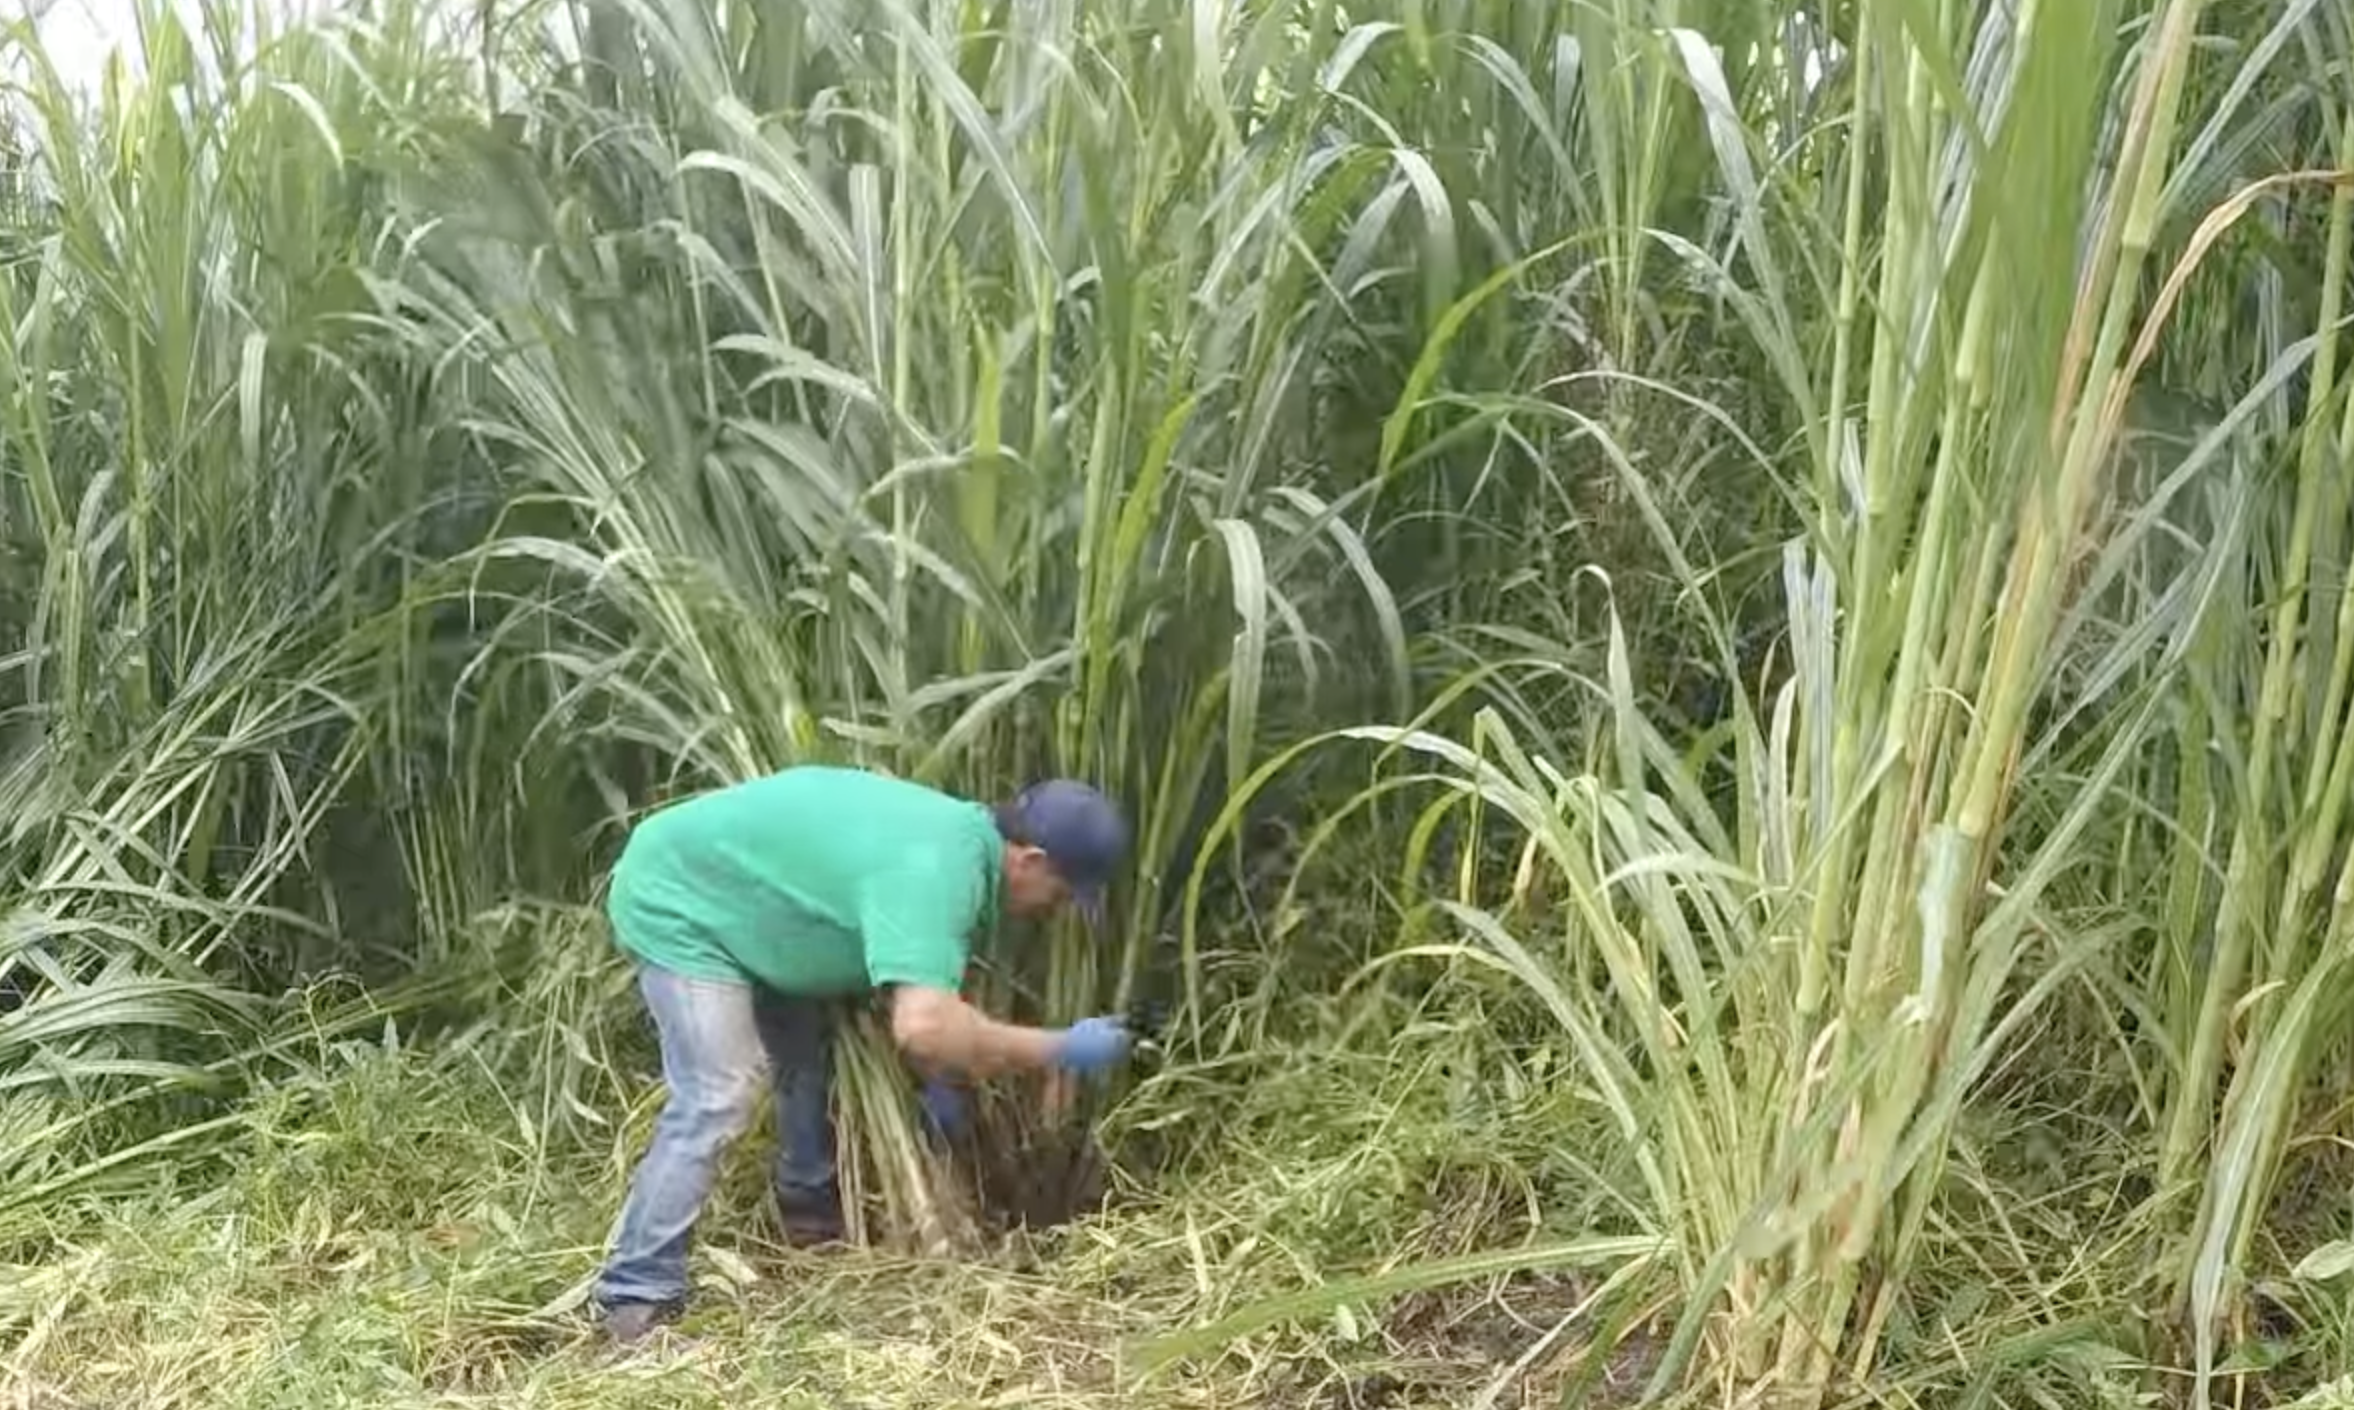
Row configuration, headlands, access, drainage and the condition of the crop base influence how equipment moves and how the stand recovers. Lower harvesting throughput increases hours per tonne. Repeated blockages, sharpening, repairs or weather delays can also narrow the window for collecting material at the intended maturity.
A pilot should measure tonnes harvested per operating hour, fuel use, interruptions, chop quality and subsequent regrowth with the actual equipment proposed for expansion. A planting geometry inherited from a long-cycle stem crop can lock in handling costs and gaps between clumps. Testing crop architecture and the harvesting system together helps identify those costs before multiplying the planted area.
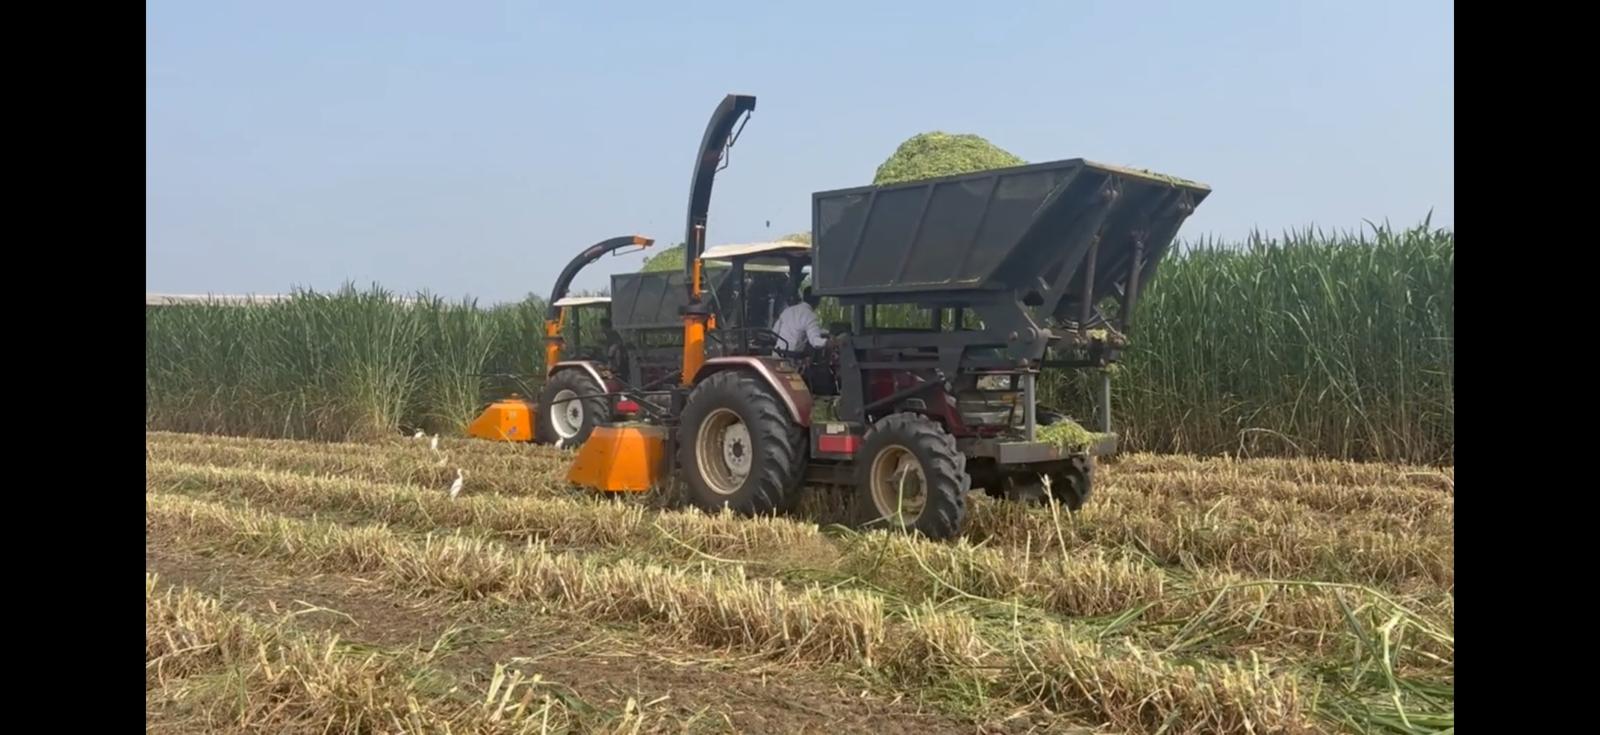
Size reduction can improve digestion, as experimental work on Napier and silage demonstrates. Its commercial value depends on the additional gas recovered against electricity, wear, labour and any heating requirements. Napier preparation and digestion study.
Put water and nitrogen on the methane ledger
An input programme becomes easier to assess when field expenditure and recovered methane share a defined boundary and period. For operating comparisons, Nm³ means gas volume normalised to specified reference conditions, with methane concentration and dry or wet basis recorded.
| Operating measure | Decision it helps resolve |
|---|---|
| Irrigation water applied, m³ per Nm³ CH₄ recovered | Whether additional irrigation earns its pumping and water cost through additional recovered gas. Record rainfall separately; this measure describes applied irrigation, while a full water footprint requires further accounting. |
| Purchased mineral nitrogen, kg per Nm³ CH₄ recovered | Whether fertiliser expenditure improves annual gas output. Track digestate-derived nitrogen and total crop-available nitrogen separately. |
| Pumping and crop preparation, kWh per Nm³ CH₄ recovered | Whether higher yield or improved digestion compensates for additional energy consumption. |
| Cultivation, harvest and delivered-feedstock cost per Nm³ CH₄ recovered | Which field, genotype and harvest programme supplies gas at the lowest sustainable operating cost. |
In a co-digestion plant, attributing gas to a particular crop requires a documented allocation method. Feed proportions, volatile solids, representative methane tests and operating periods must be reconciled. Crop-level estimates and directly metered plant totals should remain distinguishable.
The strongest comparisons follow a full seasonal cycle. A high-yielding cut can require substantial water and nitrogen, while a different programme may produce a better annual margin through lower inputs, reliable regrowth or easier harvesting.
Storage preserves tomorrow’s gas production
Silage management connects a seasonal crop with a plant requiring regular deliveries. Chop characteristics, moisture, compaction, sealing, drainage and the rate at which the silo face is used influence preservation and handling. Research on Napier silage confirms that conservation conditions can change subsequent digestion performance. Napier silage quality and anaerobic digestion study.
The commercial assessment follows dry matter and organic matter through storage, alongside the cost of the storage system. Representative sampling before storage and at feed-out helps separate changes in water content from losses of usable material. Heating, spoilage, leachate and rejected feed also belong in the record.
A reserve can support continuity while tying up working capital. Its useful size depends on harvest windows, seasonal accessibility, preservation losses and the cost of a supply interruption. The design should include the machinery and daily work needed to maintain it.
Lower-grade land has its own input curve
Land mapping can identify areas where soil, water, access or topography will create different operating costs. A low acquisition or lease price may be accompanied by expenditure on drainage, irrigation, amendments or road access. Existing land uses and ecological value also form part of suitability screening.
BEC’s approach divides the production area into practical management zones and tests crop and amendment responses within them. Sandy soils with limited water retention and poorly drained heavy soils need different interventions. Expansion follows the observed response and its cost across successive harvests.
Digestate can return useful nutrients to these zones. Its economic value depends on nutrient analysis, crop uptake, soil reserves, storage, transport and application costs. IEA Bioenergy Task 37: digestate as biofertiliser.
A nutrient budget can then show the mineral fertiliser displaced, the nutrients returned and the expense of doing so. Amendment decisions become part of the cost-per-gas calculation, with benefits tested against an untreated or current-practice comparison.
A digital record that can change next week’s decision
A useful digital backbone connects a mapped field and its management history to a harvest lot, a storage lot, a feed blend and the gas meter. It retains dates, quantities, sample results and costs in a form that field and plant teams can reconcile.
GIS provides the spatial structure. Field observations and remote sensing help target inspections. Harvest records reveal delays and uneven recovery. Laboratory data explain changes in feedstock characteristics. Gas records show plant response, interpreted with the time lag and mixing inherent in digestion.
Measurement, reporting and verification (MRV) gives those records a traceable basis: defined methods, calibrated measurements, documented assumptions and checks on data quality. Carbon-intensity assessment adds fertiliser, fuel, electricity, transport and methane-loss boundaries. This supports an auditable assessment of the supply system.
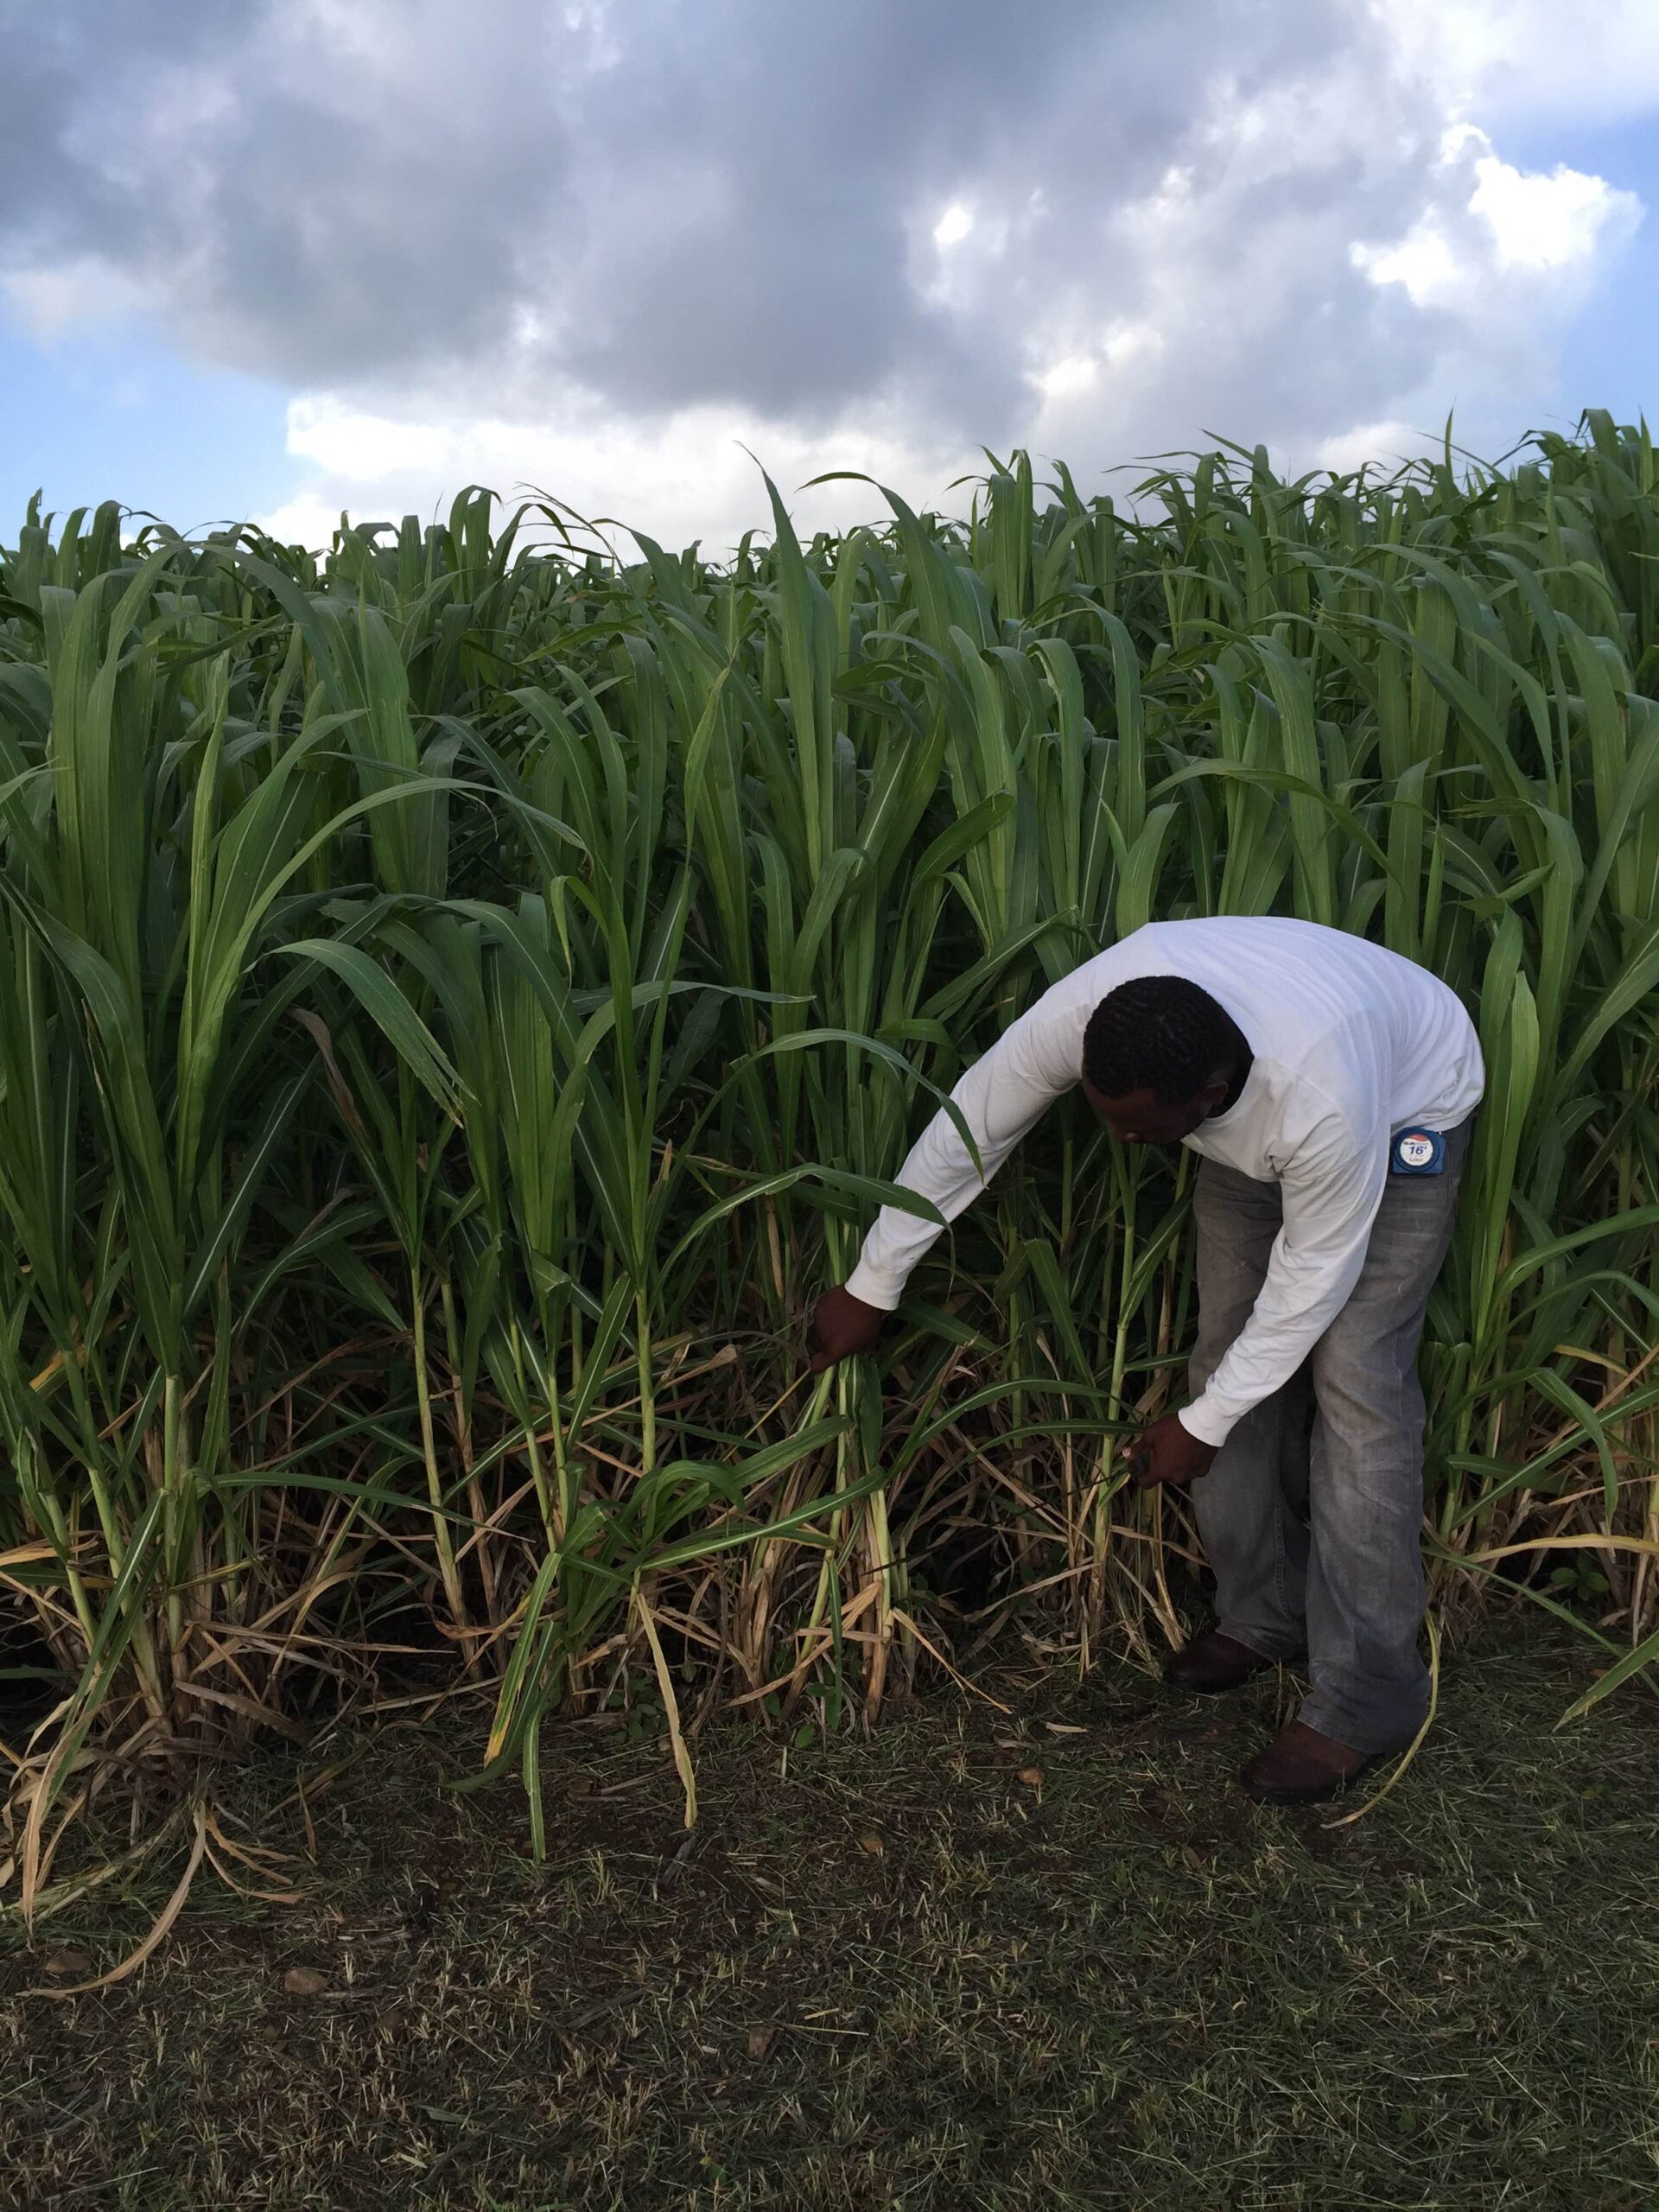
The practical output is an operating handbook that evolves with evidence: planting material by zone, establishment procedures, harvest windows, storage checks, nutrient applications and triggers for corrective action. BEC combines local pilots, agricultural mapping, agronomy and operational records to develop that system before wider expansion.
The next planting decision commits future water, nutrients, machine hours and working capital. Understanding the gas those inputs can deliver is a powerful place to start optimising the project.
Explore BEC’s work in biomass crop development and agricultural supply systems.